Case study · TitanGrid
When a rack runs hot, the ticket and the technician are already on it.
TitanGrid is an operations platform for colocation data centers: monitoring, technician dispatch, SLAs, energy reporting and metered billing in one system. We designed and built it, and it runs at titangrid.ai.
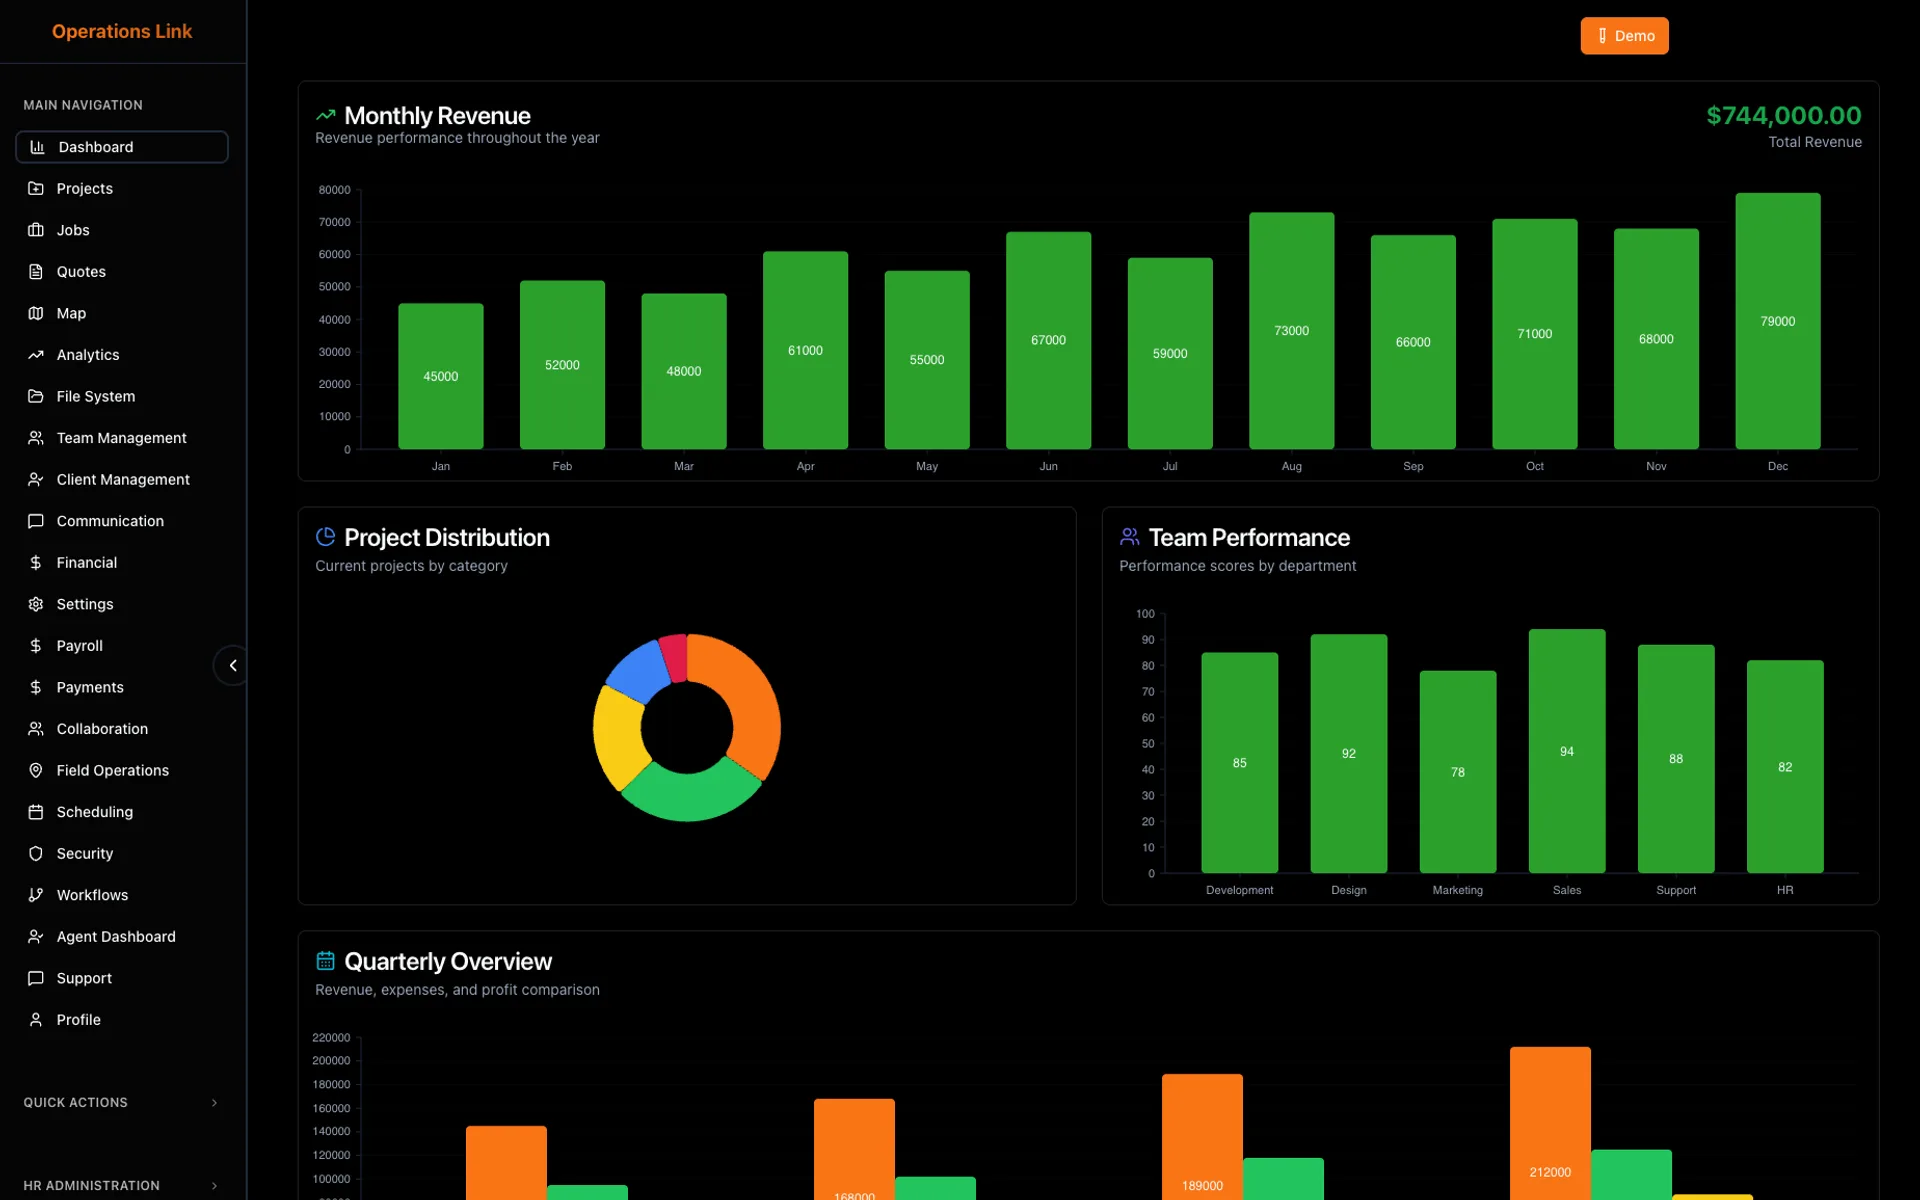
- Each rack checked against its own normal
- Every minute
- SLA escalation steps, fired on their own
- 50 · 80 · 100%
- At titangrid.ai
- Live
01The problem
Trouble was found by people watching graphs
Operators watched dashboards for trouble, picked a technician by hand, chased SLA deadlines in spreadsheets and read meters at the end of the month.
02What we built
One system that watches, dispatches and bills
An agent on site reads the equipment, the platform compares every rack with its own normal, and dispatch, SLAs, energy reporting and billing all run on the same readings.
03What changed
The response starts before anyone looks
An outlier opens a ticket and a work order and assigns the best-fit technician, SLAs escalate on their own, and every customer’s power is metered by the hour.
A day at a data center
What used to need someone, and what happens now
An illustrative day, built only from what the platform does on its own.
Overnight
Now: Health scores are recalculated; a sharp drop drafts a ticket and a predicted failure drafts a maintenance work order.
BeforeProblems found when they fail.
The weekly SLA digest
Now: Each customer is emailed their uptime and any credits owed, calculated.
BeforeA report built by hand every week.
A rack runs hot
Now: Within the minute, a ticket and work order exist and the best-fit technician is assigned.
BeforeSomeone notices the graph, then finds a technician.
One fault, many alarms
Now: Repeat alarms from the same device within five minutes collapse into one ticket.
BeforeDozens of alerts for one fault.
The SLA clock runs
Now: At half time the technician is told, at 80% an incident opens, at 100% on-call is paged.
BeforeBreaches found after the fact.
A visitor is approved
Now: The access slip and invitation go out, and the badge revokes itself when it expires.
BeforeBadges handed back, or not.
Before and after
Who used to do it, and what happens now
Every part of running the facility works from the same readings. Choose an area to see what changes.
Monitoring and alerts
An agent on site reads every device and the platform watches each rack against its own normal.
| The job | Before | Now |
|---|---|---|
| Spotting trouble | Staff watching graphs | Each rack compared with its own normal every minute; an outlier opens a ticket |
| Alarm storms | Dozens of alerts for one fault | Repeats from one device within five minutes become one ticket |
| Mixed equipment | A separate tool for each kind of device | One on-site agent reads SNMP, Modbus, BACnet and GPU telemetry, and keeps the readings if the link drops |
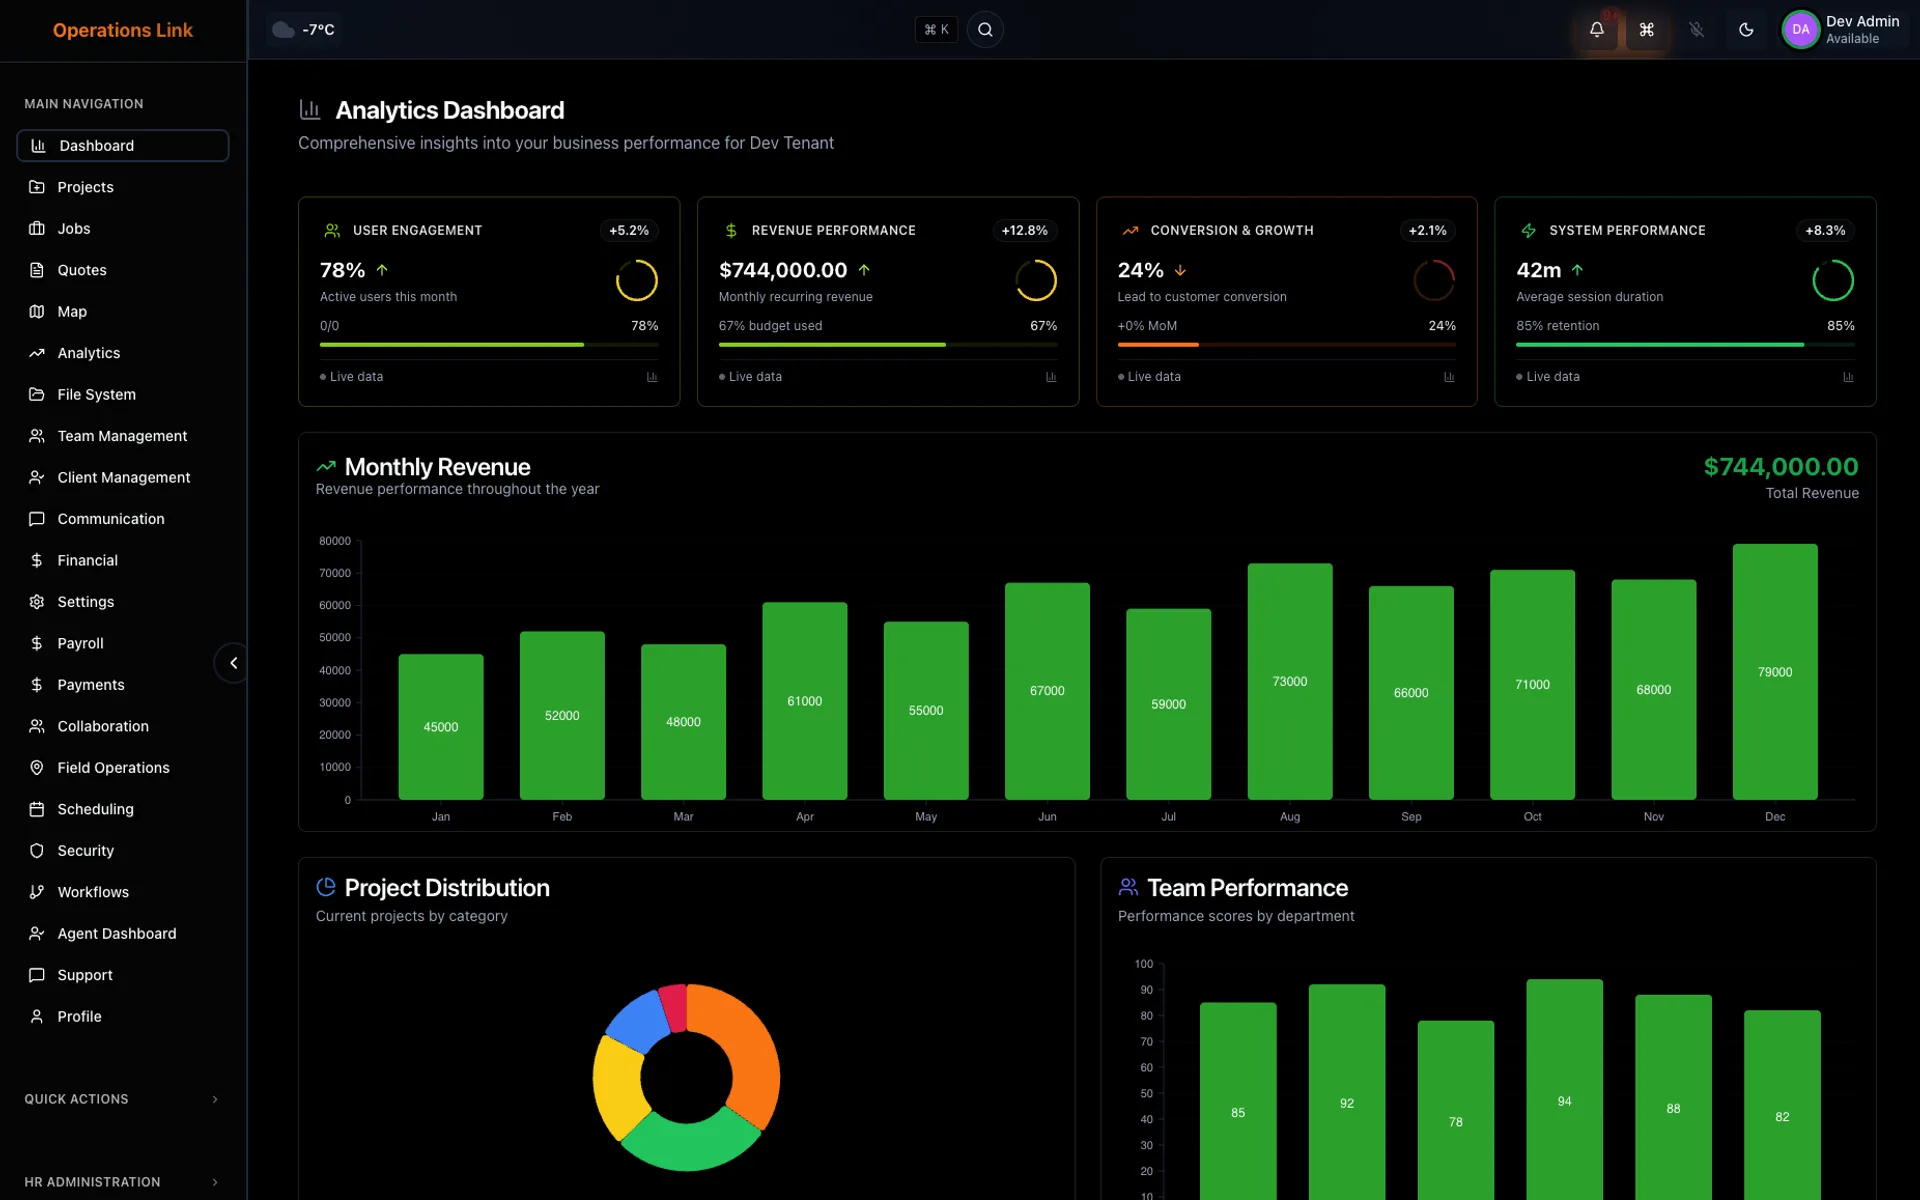
One hot rack
- Reading off its normalDetected
- Ticket and work orderOpened
- Best-fit technicianAssigned
People stay in charge
Every automation can be switched on or off for each customer, and every run leaves an audit record of what it did and why.
Under the hood, for your technical teamShow details
An on-site agent reads SNMPv3, Modbus TCP, BACnet/IP and GPU telemetry and sends it over MQTT; readings are kept in a time-series database. The platform runs on Kubernetes with single sign-on and written access policies.
Running facilities on dashboards and spreadsheets?
We build monitoring, dispatch and billing around how your sites actually run.
Book a call